02. Tidy Data
What is Tidy Data?
In this course, it is expected that your data is organized in some kind of tidy format. In short, a tidy dataset is a tabular dataset where:
- each variable is a column
- each observation is a row
- each type of observational unit is a table
The first three images below depict a tidy dataset. This tidy dataset is in the field of healthcare and has two tables: one for patients (with their patient ID, name, and age) and one for treatments (with patient ID, what drug that patient is taking, and the dose of that drug).
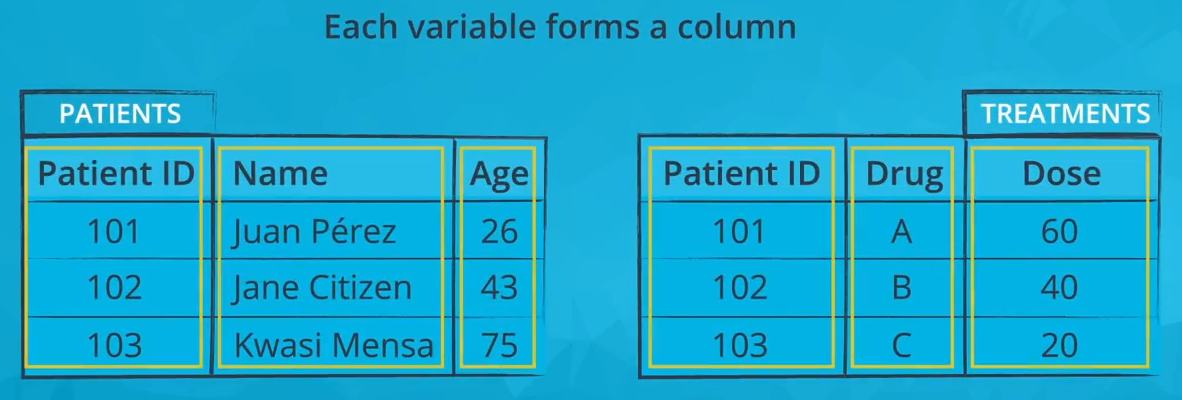
Each variable in a tidy dataset must have its own column
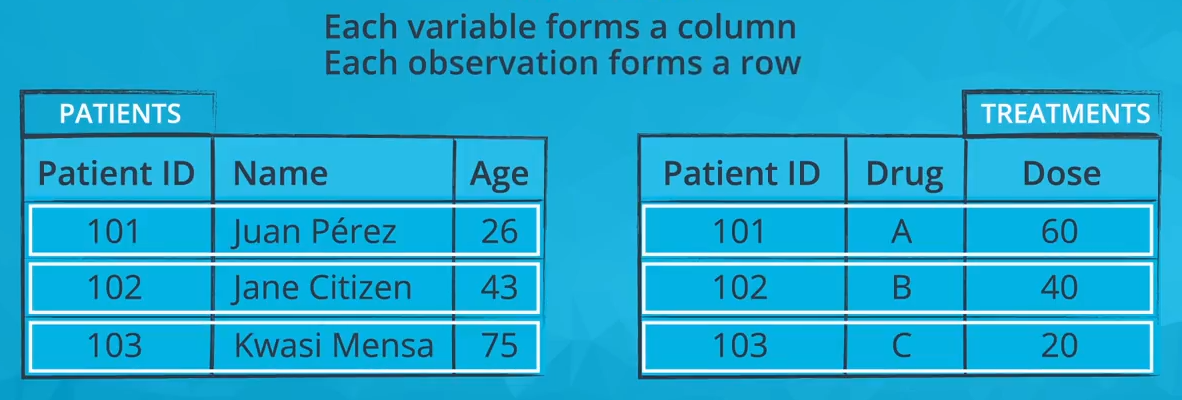
Each observation in a tidy dataset must have its own row
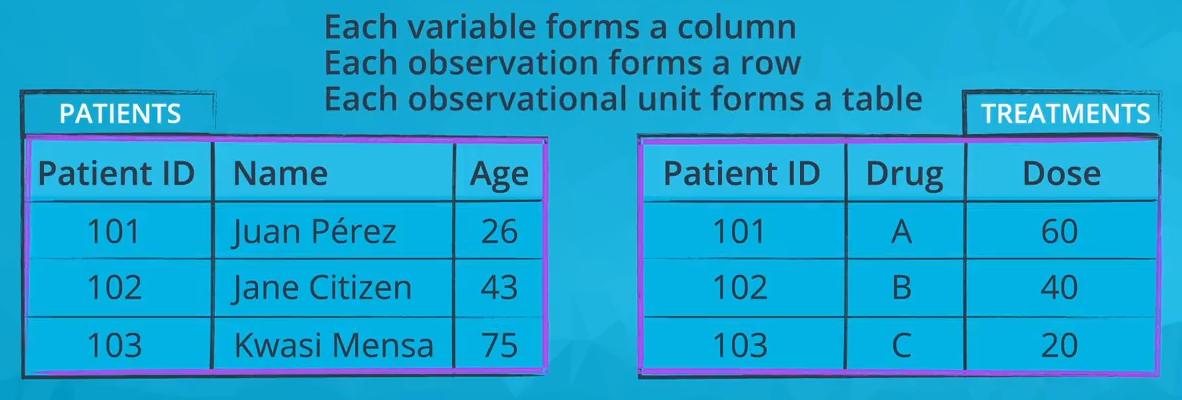
Each observational unit in a tidy dataset must have its own table
The next image depicts the same data but in one representation of a non-tidy format (there are other possible non-tidy representations). The Drug A, Drug B, and Drug C columns should form one 'Drug' column, since this is one variable. The entire table should be separated into two tables: a patients table and a treatments table.
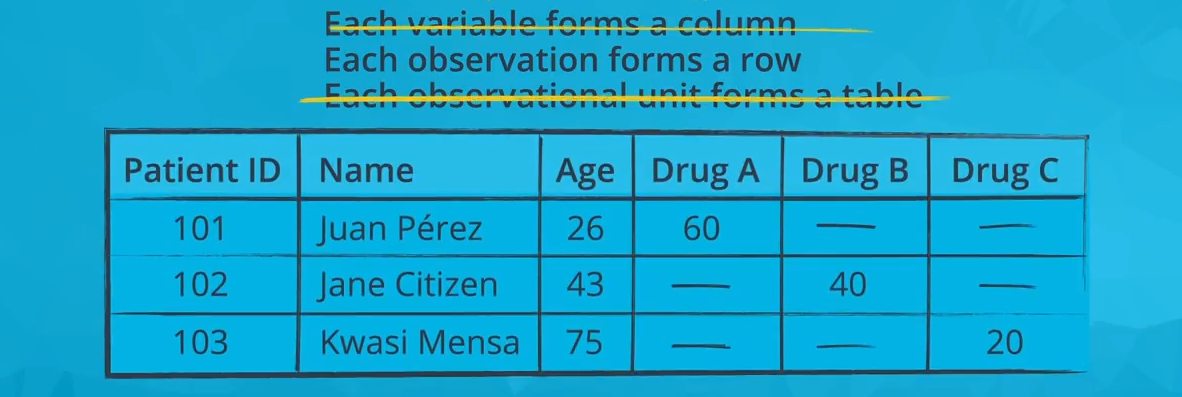
Only the second rule of tidy data is satisfied in this non-tidy representation of the above data: each observation forms a row
While the data provided to you in the course will all be tidy, in practice, you may need to perform tidying work before exploration. You should be comfortable with reshaping your data or perform transformations to split or combine features in your data, resulting in new data columns. These operations collectively are called data-wrangling.
This is also not to say that tidy data is the only useful form that data can take. In fact, as you work with a dataset, you might need to summarize it in a non-tidy form in order to generate appropriate visualizations. You'll see one example of this (bivariate plotting) in the next lesson, where categorical counts need to put into a matrix form in order to create a heat map.
Recommended Read
Refer to the Data Wrangling with pandas Cheat Sheet for a summary of functions helpful for data-wrangling.